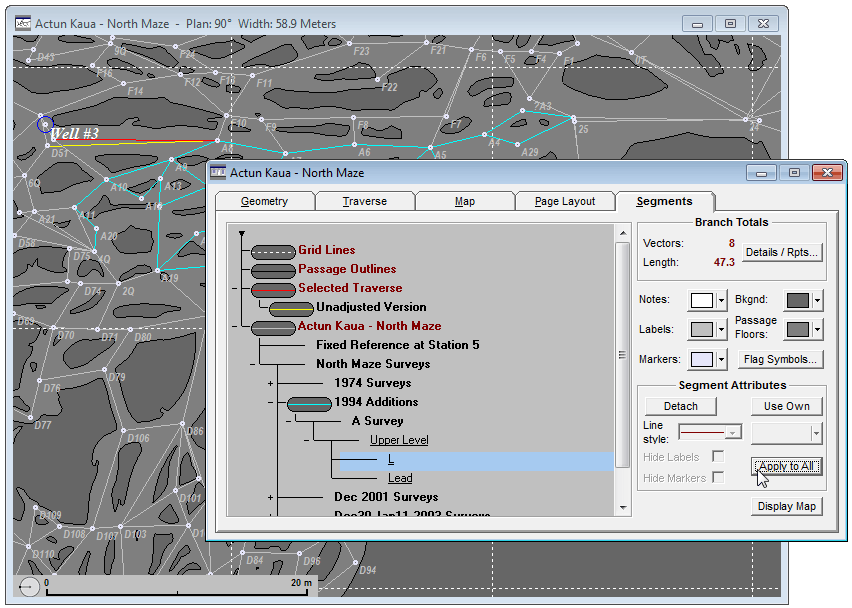
The Segments page of the review dialog has several purposes: to assign colors to common map objects, to specify visual attributes for vectors assigned to specific segments, and to select those parts of the segment hierarchy to be excluded when generating the various kinds of output. For example, for a printed map you may want to exclude the surface surveys even though they are part of the compiled data set. Also, it is on this page that you can examine statistics for different portions of the data while possibly omitting, for example, "length-excluded" vectors. The page is divided into a labeled tree diagram showing the segments for the compiled project branch and, on the right, a set of controls for operating on the tree. Below is a description of each item on the page. For more information on what segments are and how they can be defined within data files, see #Segment Directive.
Segment Tree
The segment hierarchy is represented by a tree diagram similar to the project tree, except that branches appear not only for the book nodes and data files but also for the vectors that have been assigned segment names (e.g., flags) within the data files themselves. Mouse operations also control how much of the tree is displayed. Double-clicking the root (the small triangle at the top) will expand the entire tree. Double-clicking a branch will expand it one level or collapse it completely. The presence of children is indicated by a small plus sign at it's left.
A node is represented graphically in the diagram as either a plain junction of lines, in which case map attributes will be inherited from those of a higher level node (see Inherit/Use Own below), or a capsule-shaped icon indicating that the node's own assigned attributes are active. The icon shows both the background color and vector line style. Like the project tree, nodes can be visibly detached from their parent, indicating that the corresponding tree branch will be excluded from both maps and statistical summaries. In this case, however, no recompilation of data is required.
Except for the top-level tree nodes labeled Grid Lines, Passage Outlines, and Selected Traverse (see below), each node represents zero or more vectors in the selected component of the compiled project branch you're reviewing. (Unless there are "hanging" survey fragments, there will be just one component.) For example, if a vector is defined in the data as having the segment name Upper Level/L, it will contribute to the count of vectors with L as a component of its segment attribute, of which there could be many. The vector's complete tree address might be KAUA/NMAZE/NM1994/ASURVEY/Upper Level/L, where the beginning portion, KAUA/NMAZE/NM1994/ASURVEY, is established not by the data but by the project tree hierarchy. In this example, KAUA, NMAZE, NM1994, and ASURVEY would be the base file names for the project tree branches having titles Actun Kaua, North Maze Surveys, 1994 Additions, and A Survey, respectively. (See Define Segment under Properties Dialog.) Non-bold underlined names, like L in this example, are the trailing components defined in data files. All other nodes in this tree, except for the special nodes at the top, are representative of project tree branches. The font for branch titles is the same as that selected via Options | Fonts | Branch titles in the Walls main menu.
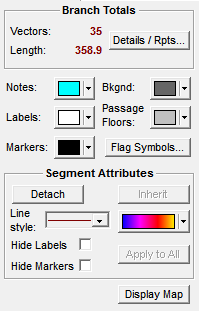
Selecting a node in the tree (e.g. by left-clicking on its corresponding line in the diagram) displays an abbreviated set of statistics in the upper right of the page under "Branch Totals": vector count and total length. If the node is expanded , the statistics summarize the node itself -- that is, vectors having this particular segment pathname. If the node is collapsed, the entire branch is summarized. In the example above, the selected node L has no branches and contains 8 vectors totaling 47.3 meters in length. There may be other L nodes in the tree. How to quickly Detach all of them to determine, say, a final surveyed cave length, is described near the end of this topic -- see Apply to All.
Right-clicking on a node activates a popup menu with three selections: 1) Segment totals brings up an expanded statistics dialog -- see Reports below, 2) Edit survey, enabled only for a project file-titled node, will open an edit window containing the corresponding survey file, and 3) Project item properties, when enabled, expands the project tree as necessary and opens the corresponding item's Properties dialog.
Top-level Tree Nodes
Grid Lines -- Select this node to specify the color and style of grid lines as described below. If it's attached to the tree, the next generated screen map will show the lines. If a map showing grid lines is already displayed, any changes you make are applied immediately..
Passage Outlines -- Similarly, select this node to specify the color and style of LRUD cross section bars. Also, if display of an SVG mask layer has been enabled via the Passage Display Options dialog, this specifies the passage outline style and color as shown in the above map image.
Selected Traverse -- This node is relevant only if the survey has loop system traverses as shown on the Geometry page. When connected, screen maps will highlight the current selected traverse with the line color and style specified for this node. There is also a subnode of this one, named Unadjusted Version, which is relevant.when the selected traverse is floated. The map in the above screenshot shows a floated traverse that reveals what is probably a mistake in station naming.
Floated Traverses -- You don't see this in the above image because it's actually a variation of the Selected Traverse node. When the node is labeled "Floated Traverses", and is attached, screen maps will instead highlight all floated traverses with another pair of style assignments. You can toggle between variations by clicking a button named Change Type, the latter a relabeling of the Use Own / Inherit button described below. More likely, however, you'll be checking boxes on the Map page to switch between types of traverse highlighting.
Below is an item-by-item description (top to bottom) of the controls that operate on the segment tree. Note that these settings are among the things preserved in the workfiles for a compiled project tree item. If you want to preserve them in an archived project, be sure to include the NTA workfile -- see Creating Backup Archives.
Reports
This button activates The Adjusted Totals dialog showing various statistics for the selected item: vector count, total length and component lengths, vertical range, etc. Options for creating ESRI shapefiles, 3D (VRML) files, and vector/coordinate listings are also presented in this dialog.
Controls that affect the entire map, independent of selected tree item, appear beneath the Branch Totals section. There are five colored buttons that bring up color selection dialogs (40-color palettes with options for more specialized selections) and a button for specifying marker and flag symbol attributes. Please Note: For displayed and printed maps (not SVGs), these settings are applicable only when the respective graphics objects are enabled (boxes checked) on the Map page.
Notes and Labels: Selects the color for station name labels or notes. The font sizes and styles, which are general preferences applicable to all projects, are determined by a menu selection (Options | Fonts... ) or by selections in the Map Format Options dialogs. There are separate font settings for displayed maps, printed maps, and metafiles.
Markers: Selects the color for station markers without affecting the other attributes you may have assigned to markers. Shapes, sizes, and colors are assigned in the Flag and Marker Symbols dialog (see below), whereas outline pen thicknesses are determined for both flag symbols and markers via the Map Format Options dialog.
Bkgnd: Selects the background color for displayed (not printed) maps and for SVG exports where the color is not inherited from the SVG. The chosen color is reflected both on the control and in the tree diagram's icons. CAUTION: You should take care that the background color differs from those of the other features you want to be visible. (Note that for printed maps the background is always white and the frame outline and annotation is always black.) Since failure to do this is such a common problem, the program will override the assigned colors for labels, notes, flags, and markers when appropriate, changing them to black or white. This is not done, however, for the vector lines and passage representation.
Passage Floors: Selects the color inside SVG passage outlines or LRUD polygons. For the LRUD polygons you can choose either a solid color or one of three types of color ranges: color by depth, color by date, or color by component F-ratio. (See Color Dialogs.) When floors derived from a source SVG are being displayed within either Walls or Walls2D only the last selected solid color is relevant. |
|
Flag Symbols... Opens the Flag and Marker Symbols dialog, which lets you chose shapes, sizes, and colors separately for all categories of stations in the compiled data set. The marker symbol style and color can be chosen there as well. The names of assigned flags (e.g., entrances, GPS positions, etc.) define the named categories.
Segment Attributes
These controls make assignments to the selected node in the tree diagram. In most cases, the appearance of the node icon will immediately reflect any changes you make. The nodes corresponding to segments and also the special nodes, Grid Lines, Passage Outlines, and Selected Traverse, can be given assignments. Also, one level beneath Selected Traverse is a child node labeled Unadjusted. You can use it to specify separate attributes for the unadjusted version of a selected traverse that happens to be floated.
| • | The Detach / Attach button removes/restores the node's connecting line to its parent. Only when there is an unbroken path to the tree's root are the node's vectors displayed on the map. The attached state of a node also determines whether or not vectors in the branch are included in statistical summaries for a parent node. The attached state of the special nodes, Grid Lines and Selected Traverse, reflect the status of their corresponding check boxes on the Map page. The Selected Traverse node, if attached, causes any segment-based assignments to the traverse's vectors to be overridden, a feature normally used only while data screening. |
| • | The Use Own / Inherit button activates/deactivates the style attributes assigned to the selected node, such as line style and color. When a node is in the inherit state, the corresponding vectors will take on the map attributes assigned to the nearest higher-level node that happens to be in the Use own state. On the tree diagram inheritance is indicated by a missing capsule-shaped icon. Also, the following style controls are disabled, although they continue to reflect the node's current assignments. (This button is relabeled Change Type and has a different function when the third top-level node is selected.) |
| • | A list box containing seven line styles appears just beneath the Detach / Attach button. The first entry is the thinnest possible (1-pixel) solid line. The second entry is a "thick" solid line whose thickness when applied to survey vectors is determined by a setting in the Options | Displayed maps... or Options | Printed maps... dialogs. When applied to the Passage Outlines tree item, the actual thickness of the "thick" line style is determined by a setting in the Passage Display Options dialog. The third through sixth entry are the various dashed line styles. |
| • | IMPORTANT: The last line style entry, which you can select by highlighting its background, corresponds to "no lines". This is the only way turn off just the vector lines in a generated map. (In a Display map frame you can toggle their visibility via the right-click context menu.) Unlike a detachment, selecting no lines hides the node's vectors without affecting other vectors in the branch. Note that line style settings currently have no effect on exported SVGs, which always feature thin solid lines. |
| • | The line color button next to the line style box lets you to select a color or color range for the selected node's vectors. Like other controls in this section, it is disabled (grayed) when the node is in the inherit state (see above). Note that this is the only vector style attribute applicable to exported SVGs. Even when the option "Preserve styles and colors" is enabled during an SVG export, new vectors not already represented in the merged file will be given this color. When the Passage Outlines tree item is highlighted, you use this to button specify the line style and color for SVG outlines and LRUD cross section lines. (Double-clicking that tree item opens the Passage Display Options dialog, which lets you specify how passage data is to be displayed.) For exported SVG maps, however, only the passage floor color is relevant, and then only when the SVG Export dialog setting, "Preserve styles and colors", is disabled. In a merged SVG export, the passage outline colors and thicknesses are always established by the source SVG. |
| • | The Hide Labels and Hide Markers check boxes allow you to selectively turn off station name labels and station markers, respectively, for vectors in the selected segment. For a station to be marked or labeled, it's necessary for at least one adjacent vector to have the respective attribute unhidden. NOTE: These segment settings are ignored when the corresponding features on the Map page are turned off -- that is, check boxes Label or Mark unchecked. In that case, no stations anywhere are labeled or marked. |
| • | The Apply to All button is available to easily assign the same set of map attributes to all nodes in the segment tree with the same name. For example, there may be many tree branches having nodes with the same name, such as L in the above example. Such nodes generally correspond to flag-type attributes assigned to vectors in data files. After confirmation, all settings in the Segment Attributes control panel, including the Detach/Attach and Inherit/Use Own states, are transferred to identically named nodes. (Case is significant.) |
Display Map Button
This button has the same effect here as it does on the Map page: It generates a new screen map frame, initially covering the region shown on the preview map. The "Apply to Map" button of earlier Walls no longer exists because changes made on the Segments page are immediately applied to all map frames showing the network component being reviewed. Note that the menu options File | Print... and File | Print Preview are also available when this page is active. For more information on generating maps, see Map Page.