Three dialogs are available for controlling the appearance of generated maps. These are general preferences that are not specific to a compiled portion of a project. Their status is preserved between different invocations of the program. All three dialogs, Options | Printed maps..., Options | Displayed maps..., and Options | Exported maps... are described here since they are very similar. You are encouraged to experiment with the settings in these dialogs. The printer and display versions are both easily accessible via a button on the control panels of both the Map page and Page Layout page. The export version is available via the File | Export map as file.... dialog as well as via the Options | Fonts.. menu selection.
You can toggle between the printer and screen versions of this dialog by clicking a button at the bottom left, labeled Printer or Screen. Clicking OK (or Cancel) will preserve (or discard) any changes you've made to either set of parameters.
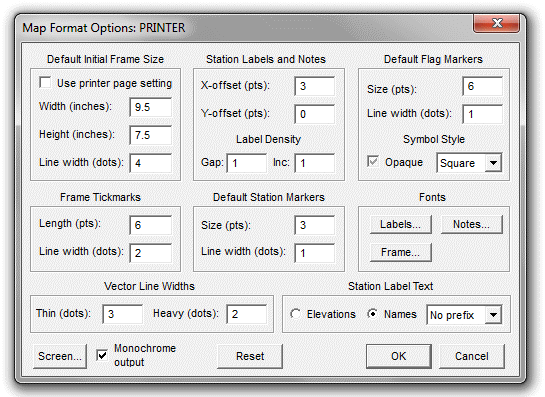
Selecting Reset, followed by OK, will restore everything but the settings in the Fonts section to the program's default values.
Notice that certain parameters (e.g., symbol sizes and offsets) are given in "point" units. For printed output a point is 1/72 inches -- approximately 4.17 dots on a page printed with a 300 dpi (dots/inch) laser printer. For screen displays, where the resolution is assumed by Windows to be 96 dpi (actual resolution will depend on system settings and monitor size), a point corresponds to approximately 1.33 pixels. Point units are convenient because they are the same units we normally use when selecting character font sizes.
Line widths are specified in actual dots (pixels) since they allow us better control of the appearance of lines. This means, however, that if we switch printer resolution from, say, 300 dpi to 600 dpi, we might also need to double the line width values to insure that printed lines retain their original boldness.
Default Initial Frame Size
The frame dimensions determine document size and will contain the geographical region shown in the preview map and specified in the Scale and Position Dialog. For printed and exported maps (not screen displays), the width and height entered here will be relevant only when project items are compiled for the first time. Normally, you'll want these settings to be compatible with (i.e., smaller than) the most commonly used printer page size. After an item is compiled, frame dimensions for plans and profiles can be independently previewed and optionally changed via the Page Layout page of the Review dialog. Thereafter, the item-specific dimensions will be preserved in the workfiles. For a compiled project branch there are two active document sizes to work with and change as necessary: one for plans and one for profiles.
For screen displays, only the frame width is relevant -- the width-height ratio will be the same as that of the preview map. Also, changing the Width setting at any time will determine the size of all subsequently generated frames. (See below.)
Unlike earlier versions of Walls, printed maps and metafiles share the same frame dimension settings. For example, changing the initial frame size default in either the metafile or printer version of this dialog will change it for both output types. With printed maps, if the frame size is too large for the output device's printable area, you will be informed of this situation at the time a print job is started. For metafiles this situation doesn't arise since printable area is meaningless for file output. (Instead you must consider the final destination.) Therefore, when generating WMF and SVG files, you can ignore the white page image representing the printable area in the Page Layout diagram.
Currently, the maximum allowed width or height for a Walls plot of any kind is 72 inches. To go beyond that you will need to output separate plots (or metafiles).
| • | Use printer page settings - Instead of specifying a fixed default frame size, you can optionally let Walls select one automatically. The selection will be based on the Windows printer settings at the time of an item's compilation. The selection that will result with the current printer setup is indicated by the grayed contents of the Width and Height edit boxes. |
| • | Width - The default frame width in inches. For displayed maps, the actual frame width will depend on the monitor's screen resolution. The actual frame width will match the Width setting only if this resolution is 96 dpi. If the specified width is too large for the available screen area, you can use the scroll bars to pan to different portions of the frame. |
| • | Height - The frame height in inches. This setting is enabled only for printed and exported maps. If the resulting aspect ratio is different from that of the Map page's preview map, the specified view's center will still be at the center of the frame, resulting in a taller or shorter geographical region being printed or exported. The region's width, however, will always reflect what's shown on the preview map. Displayed (screen) maps will have the same height-to-width ratio as the preview map. |
| • | Line width - The thickness in dots of the frame outline. For laser printers (300 dpi), a setting of 4 is usually a good choice. To omit the frame outline, set this to zero. Displayed maps have no frame outline as such. For metafiles, thicknesses greater than one dot will be interpreted as one dot. |
Important Note: A plotted frame outline will surround the view but not cover any part of the view. Therefore, when taping together pages of multi-page maps, thick frame outlines can be trimmed off entirely to facilitate accurate matching of plot segments.
Frame Tickmarks
| • | Length - The tickmark length in points. |
| • | Line width - The tickmark line width in dots. |
| NOTE: Tickmarks are drawn only if the "Use Tickmarks Instead of Grid" option is checked in the Interval... dialog accessed via the Map page. |
Vector Line Widths
| • | Thin and Heavy - In the Segment page, vectors belonging to a segment can be assigned one of several line styles as shown in a list box on the control panel. The top two list box items are illustrations of a thin solid line and a heavy solid line. The settings in this dialog determine the actual thickness of these lines (in dots) when they are drawn on the map. Unfortunately, the widths of dashed and dotted line styles aren't currently adjustable; they're always one pixel wide. Also, the "thin" version of grid lines is always one pixel wide. |
Station Labels and Notes
| • | X-Offset - The top-left corner of the first character cell will be offset this many points to the right of the station's actual location on the map. The initial default is 3. |
| • | Y-Offset - The top-left corner of the first character cell will be offset this points dots down from the station's actual location on the map. The initial default is 0. |
| • | Gap (or Spacing) - The minimal distance (in units of character cell height) allowed between displayed station labels and notes. Labels and notes that would encroach upon previously-drawn text are simply not drawn. (Labels are always drawn after the notes are drawn.) Gap=1, the default, provides the maximum label and note density without overlap. Gap=0 eliminates proximity testing, forcing all text to be drawn provided Inc=1 (see below). |
| • | Inc - A positive integer that determines station labeling frequency. (Notes are unaffected.) A value of 1, the default, causes every station to be labeled provided it passes the proximity test (see Gap above). A value of N insures that at least N-1 unlabeled stations separate labeled stations in the drawing sequence -- a sequence that tends to follow the network's traverses. For example, with Inc=10 and Gap=0, every 10th station will be labeled. A possible use of this feature is to prevent storing too many objects in a metafile, something that could crash the program it's intended for. The use of Gap>0 alone would scatter the labels uniformly over the map, whereas Inc>1 allows clustering of labels where stations are densest. |
Station Markers
| • | Size - The default marker size in points. This is the length of each of the horizontal and vertical components of the "plus sign" that's drawn to mark a station's location when station marking is enabled. The marker symbol's shape, color, and size can be overridden for compiled data in the Flag and Marker Symbols dialog. NOTE: Regardless of the dialog version (screen, printer, or metafile) changing the marker size default changes it for all output types. |
| • | Line width - This is the thickness in dots of each of the marker's horizontal and vertical components. For screen output you'll normally leave this set at one. (You can see the effect of this setting in the Flag and Marker Symbols dialog). For high resolution printers, you'll probably want to increase line width to several dots. |
Default Flag Symbol
This section defines the map symbol that will be used, by default, for flagged stations. This symbol can be overridden for specific flags via the Flag and Marker Symbols dialog. NOTE: Only the line width is specific to output type (screen, printer, or metafile). Changing any of the other settings changes them for all output types. For more information see #Flag and Symbol Directives.
| • | Size - The default symbol width (and height) in points. |
| • | Line width - The thickness in dots of a flag symbol's outline. This parameter is ignored when a solid symbol is being drawn. Normally, you'll leave this set at one for screen output, since outline thickness currently can't be assigned individually to different flag symbols. (You can see the effect of this setting in the Flag and Marker Symbols dialog.) For high resolution printers, you'll probably want to increase line width to several dots. |
| • | Clear/Solid/Opaque - This check box has three states. If unchecked ("Clear"), the flag symbol will be an outlined figure with a transparent interior. If checked ("Solid"), a solid figure will be drawn using the current marker pen color. If grayed ("Opaque"), the symbol will be an outlined figure filled with the current background color. The centers of solid and opaque symbols are indicated with a differently colored dot. |
| • | Squares/Circles/Triangles - This drop-down list box allows you to select one of several shape options for the default flag symbol. |
Fonts
These buttons bring up dialogs that are also accessible via Options | Fonts |... menu selections:
| • | Labels... - Invokes a dialog for selecting the station label font. |
| • | Notes... - Invokes a dialog for selecting the font for annotation defined via the #Note directive in data files. |
| • | Frame... - Invokes a dialog for selecting the font used for the legend, or frame annotation. (Title, scale, view, etc.) It is relevant only for printed maps and metafiles. The frame-relative location of the legend is specific to compiled items and is specified in the Page Offsets and Legend dialog. |
Station Label Text
| • | Elevations - When selected, elevations above the survey's reference will take the place of station names when labeling is enabled. Elevations will be shown to the nearest tenth of a unit (feet or meters). |
| • | Names - When selected, station labels will consist of base names (8 characters maximum length), possibly with a prefix prepended to it. |
| • | Prefix levels - A drop-down box offers four options for constructing the prefix: No prefix, Prefix 1, Prefix 2, and Prefix 3. For example, when Prefix 2 is selected, name prefixes of level 2 and below will be prepended to a station's base name using colon separators. No more than eight characters of each prefix component will appear. (See #Prefix Directives.) |
Color Translation
| • | Monochrome - When checked, color assignments will be ignored and all map features will appear in black on a white background. The background color will always be white for printed and exported maps, whether or not this option is set. When not set, the colors of some enabled features (e.g., markers and labels) might be forced to black or white if they would otherwise be invisible against the background. |