While either the Map page or Segments page is active, a screen map window can be opened via the Display Map button. The window remains a component of the Walls desktop until it is specifically closed, or until the project window is closed. This means there can be multiple map windows showing different views. The region initially shown is what's currently visible in the Map page's preview map (or tracker rectangle if one is present). Thereafter you can use the mouse for scroll-wheel zooming and right-drag panning. You can also resize the frame by left-dragging its borders.
The initial visibility of station markers, names, flags, and notes are controlled by check boxes on the Map page. Style attributes such as background color, station marker and label color, line styles and colors for vectors and grid, etc., are determined by settings in the Segments page. The visibility and appearance of individual survey segments are also controlled via the Segments page.
Displayed maps can be zoomed, panned, and manipulated as long as the corresponding project item is being reviewed (as indicated by a crosshair cursor). For example, you can left-drag to open a zoom rectangle, or double-click to pan to a specific location. Also, the distance measuring tool works the same way it does on the preview map. Operations such as returning to preview map view and resetting the default initial frame width are available from a right-click context menu. Other menu selections allow you to toggle the display of labels, prefixed labels, markers, flags, notes, and passages.
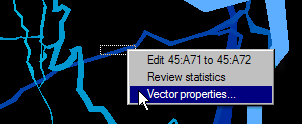
As illustrated below, a different context menu can appear when you click near a displayed vector or flagged station. The menu's choices allow you to jump to the object's definition in an editor window, to highlight the object's statistics on the Traverse page, or to display a Vector Properties window.
|
Whenever the scale is such that a screen pixel represents two meters or less, survey vectors are automatically highlighted as you move the mouse pointer over them. If an enclosing rectangle is present, right-clicking displays a menu like the one at left. If the pointer is not near a vector when you click, a different menu appears -- one that supports zooming, layer toggling, and other operations. |
![]()
If highlighting is enabled and there are features to highlight, the mouse pointer will appear as a cross with an "i" subscript. Otherwise it will be a plain cross, the measure-distance icon, or the default mouse pointer (typically an arrowhead). The default pointer is present when the data currently displayed in the map window is no longer being reviewed.
Flagged stations are also highlighted as you move the pointer over their symbols. There is no scale requirement for highlighting such stations, except that flag display must be turned on.
New! The above menu now has option named View segment which jumps to the corresponding Segments page tree node. There you can quickly change color and style.
Setting the Initial Width of Displayed Map Frames
The default initial size is a setting on the Map Format Options dialog. During data screening, for example, you might prefer that a small 6-inch wide window pops up. At other times you might want a full-screen or even larger (scrollable) image where more detail is visible at once for a wider region of the project. Note that these so-called "inches" are not physical screen inches, but are based on what was once considered a standard monitor resolution: 96 pixels per inch.
This initial width setting can also be quickly changed by selecting Set Initial Frame Size from a screen map's context menu.
The Options | Printed maps... dialog has the corresponding frame size setting for printed maps. Note that for printed output both the default initial frame height as well as the frame width can be specified. (See the Page Layout dialog.)