The second tabbed page of the Review dialog, the Traverse page, displays details for a specific traverse in the loop system currently being examined. Normally you select this traverse via the Geometry page, but you can also scroll through the system's traverses using the "<<" and ">>" buttons at the bottom of either the Traverse page or the Map page.
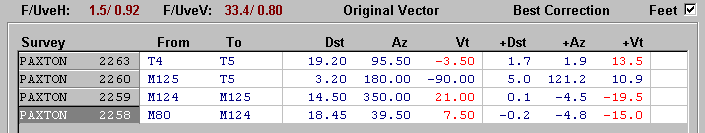
At the top of the page are the statistics F/UveH and F/UveV, the same ones appearing in the Traverses list box on the Geometry page. (For their definitions, see Geometry Page.) In the upper right corner is a check box, "Feet", that allows you to toggle between feet and meter units for the displayed length data. (Its initial status depends on the "Display Feet" setting for the project tree item that was compiled. See Properties Dialog.)
Occupying most of the page is a table featuring all of the traverse's vectors. The ordering of vectors is along a connected sequence; that is, each vector connects to the ones immediately above and below it in the table. The following vector properties make up the table's columns:
Survey
The first column contains the location of the vector's definition: a file name (without the extension) along with a line number. Double-clicking anywhere on the row will open (or activate) an edit window into the data file with this line highlighted.
From To
The second column shows the FROM and TO station names in the same order that they appear in the vector's original definition. While adjacent vectors have an endpoint in common, a vector's FROM station, for example, will not necessarily match the TO station of the vector just above it. This choice of direction makes comparison with the original data much easier. A station's name prefix, if any, is not shown.
Original Vector
Listed under the headings Dst, Az, and Vt is the originally measured vector converted to a set of three equivalent "measurements": distance (feet or meters), azimuth (degrees), and vertical angle (degrees). This may or may not exactly match what appears in the data file, since instrument corrections, declinations, height adjustments, etc., have already been applied. This means, for example, that azimuths will either be true north-relative or grid-relative. You can, however, use the "Feet" check box to switch between distance units.
A fixed point vector -- that is, a station connected to the implied zero reference, <REF> -- will be displayed with zeros in the Dst, Az, and Vt columns. Although the "observed" vector components (e.g., UTM coordinates) could have been displayed instead, they would not be particularly useful in this context. The zeros help make this special case stand out and emphasize that the +Dst, +Az, and +Vt fields are an east-north-up best correction for the fixed point (see below).
Best Correction
Listed under the headings +Dst, +Az, and +Vt are the three numbers that when added to those of the previous three columns (Dst, Az, and Vt) would completely eliminate the discrepancy between the traverse and the rest of the network (adjusted with the traverse excluded). Note that only one of the listed vectors must be so corrected to close the traverse. The east-north-up components of this best correction are displayed with the label "ENU Closure" at the bottom of the page.
Occasionally you will notice that one of the numbers is displayed in a red font. For example, you might see something like this for +Dst, +Az, and +Vt :
... | 0.02 -9.21 -0.51 |
The color change occurs only when exactly one of the three corrections -- that for the azimuth in this case -- exceeds a predefined tolerance level. By default, these tolerances are 1 meter, 5 degrees, and 5 degrees for the distance, azimuth, and vertical angle, respectively. (You can change these tolerances via the Walls menu -- see Options | Compilation | Vector Highlighting...) The idea, of course, is that if a traverse fails to close because of a blunder, then there is a good chance that just one bad measurement is responsible. Vectors for which a single measurement change is suggested are therefore suspect. Given the above example, we might discover that an azimuth reading of "250" was mistakenly keyed in as "259".
In the case of fixed point vectors (one station being <REF>), the east-north-up components of the best correction appear instead of +Dst, +Az, and +Vt. This is how much the fixed point would need to be moved to close the traverse. In this case, the tolerance level for distance is applied to each component to determine highlighting. Note that these components will be grid-relative if the option to generate UTM grid-relative coordinates was in effect during compilation ( or if a non-zero #Units GRID parameter was applied) . (See #FIX Directive.)
Except for the odd case of a constrained traverse (see NOTE below), the numbers on the Traverse page -- apart from the statistics at the top which can be replaced by "<FLOAT>" -- are independent of whether or not the traverse has been floated. Although the best correction, by definition, is unaffected by the traverse's own float/unfloat status, the status of other traverses in the system can of course make a difference. In fact, when multiple blunders are evident, a good strategy is to float all traverses with conspicuously large F-ratios before examining the Traverse page for suggested corrections.
The "ENU Closure" at the bottom of the page is the best correction in the form of a vector that must be added to the traverse to make it consistent, where the traverse's direction is defined to be along the sequence of listed vectors, from top to bottom. (If there is just one vector, the FROM and TO names define the direction as usual.) Like the vector azimuths, these error components will be true north-relative unless the option to generate grid-relative coordinates was in effect during compilation.
Also at the bottom of the page is "Hz Len", the traverse's horizontal length, and "Vt Len", the traverse's vertical length. The former is simply the total length of the vectors in plan view. The latter is the sum of the absolute values of the vertical components.
NOTE: There is one circumstance when a traverse's statistics, including the best correction, are not provided by the program, even though they technically exist. This occurs when the traverse has been constrained, as indicated by the word "<FIXED>" shown in place of the statistics (horizontal and/or vertical) at the top of the page. In this case, zeros replace the actual best correction. To obtain the latter you can return to the Geometry page momentarily and float the traverse. Alternatively, you can override the zero variance assigned to a vector in the data file with a small value such as 0.01 -- a tactic that will also produce an F-ratio. If the idea bothers you that a constrained traverse should be considered error prone, then you can think of the F-ratio as testing not the traverse, but the remaining loop system as a whole.