SVG roundtripping is the back and forth exchange of SVG-formatted data between two processing programs, the goal being to produce a more complete SVG document. In the version of it described here, an illustration program contributes data based largely on field book sketches, while Walls contributes data based on field book numbers. The result of this roundabout sharing of data, at least in principle, is a complete cave map that's always up to date.
The Walls implementation borrows ideas from both an article of mine and a paper presented at Siggraph '92 by Thaddeus Beier, Feature Based Image Metamorphosis. In Beier's paper, a technique is presented for computing transformations between raster images in an animation. The method deviates from traditional mesh warping in that it uses a small, optimally chosen "skeleton" of superimposed line segments instead of a mesh. While the math is similar in some respects, we will be morphing vector art in SVGs as opposed to raster images. Also, survey lines -- or rather their plan projections -- will serve as the skeleton.
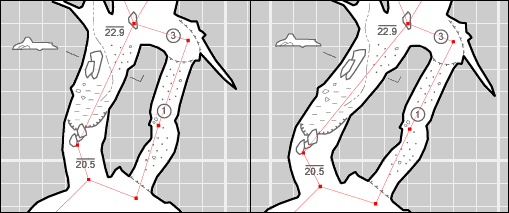
The above split image, a Walls2D screen capture, shows the result of changing the azimuth and length of one shot in a surveyed loop, recompiling the project, and creating an updated SVG (right frame) based on an original drawing, or source SVG (left frame). Coordinates will often change this much, but a local reshaping this extreme will only arise when a blunder is being corrected. Note that lengthening the vector stretched the left passage's walls and floor details longitudinally while leaving its width almost unchanged. That's due to the warping algorithm Walls uses, one which tends to preserve a feature's absolute perpendicular distance to a vector and its proportional distance along the vector's length. The outline of the right passage was affected very little by the correction, even though its location changed significantly. This is characteristic of a morphing technique that's feature-based rather than mesh-based.
This example also shows the effect of placing objects in special layers so that only their locations will change, not necessarily their shapes and orientations. The clay symbols, for example, became less dense but remained horizontal due to their layer placement. Also, grouped sets of features in this layer, including the cross section group and the ceiling height symbols, were treated as single objects and not distorted or broken apart. Finally, the example illustrates a type of feature that's not always handled particularly well. The line segments indicating the position of the cross section were properly translated as a group, but they also should have been rotated slightly. Since there is currently no provision for this type of adjustment, a one-time manual repair is needed, as will sometimes be the case near a survey blunder. For another example with more explanation see Adjustment of Brushed Strokes.
The adjustment of artwork stored as SVG is a complex operation, but the details are handled automatically if the document follows some layering conventions. (See SVG Layer Definitions.) Features in sym layers, like symbols, text, and cross sections, will track the survey, but they will be translated and scaled, not reshaped, and will maintain their page-relative orientation. Features in shp layers, on the other hand, can also be of the non-reshapable kind, but their north-relative orientation is maintained. Furthermore, path-like features in shape layers can be morphed (warped in a smooth or continuous fashion) to fit the updated positions of nearby survey vectors. In a passage wall outline, for example, the final position of each path control point depends individually on a weighted average of the shifts in the N closest survey vectors. (Certain weighting parameters, like N and drop-off of a vector's influence with distance can be specified in an Advanced Settings dialog.) A feature adjustment, therefore, requires a method for finding the 1st, 2nd, ..., and Nth vector closest to each symbol and path control point. A map with thousands of survey vectors might have control points numbering in the hundreds of thousands, so the method obviously involves a lot of computation. The "nearest-vector" algorithm in Walls is efficient, however, requiring more work than a least-squares adjustment but still taking only seconds to execute on a modern desktop or notebook computer.
How It Works in Practice
It's easy to get the process started. After setting up a map view in Walls, as you would when preparing to print, you instead export an SVG file. The result is similar to a metafile export except that survey vectors have identifying tags (XML id's) that the illustration program leaves intact during import-export operations. (It has to if it qualifies as an SVG editor.) Also, the map is usually georeferenced so that UTM coordinates are displayed in Walls2D, an integrated SVG viewer.
In the initial data export from Walls, some specially-named, empty graphics layers are created in addition to the usual survey lines and symbols. The file is then opened in Adobe Illustrator (or theoretically another drawing program), where the user places artwork inside those layers. Such artwork might include cave walls, floor and ceiling details, scale, north arrow, and annotation -- all in whichever style the user prefers. Subsequently, whenever this decorated map is ready for use by Walls, either for updating or for generating new map views, it's saved as a source SVG.
At appropriate times thereafter, a different kind of SVG export can be invoked from Walls: one that creates a new SVG file while merging artwork from one or two existing source SVGs. The merged artwork is also transformed to fit survey lines that may have changed in a least-squares adjustment. The new SVG, possibly with extended survey lines, can in turn serve as a source SVG for either Illustrator or Walls. It's like Illustrator's version quality-wise, except that it now accurately reflects the current state of the survey. If the cave was extended with new surveys, the exported file can be brought into Illustrator and the process repeated. An important characteristic of SVG roundtripping is that image quality doesn't degrade as it often does when a raster image undergoes successive conversions -- the repeated replacement of a source file with an output file of an earlier process.
Whether or not it's meant to be used as a source for new exports, an SVG cave map (last written by either Walls or Illustrator) can be viewed and printed from within Walls, distributed with Walls2D as a standalone interactive map, or posted on the Internet as part of a Web application. It can even be revised with a text editor (certain styles changed, elements added or removed, etc.) since SVG is standard XML text.
Profile views currently can't be exported as SVG, a restriction that will soon be removed. One reason it exists now is that additional coding is required to insure that specific profile orientations are maintained in merge operations. Also, this capability will benefit from the implementation of vertical clipping planes, another planned feature. Without the latter, too many irrelevant vectors would likely project onto the plane of the profile, thereby complicating a feature adjustment.
For a similar reason, plan views of caves with a lot of vertical complexity will be more difficult to deal with than plan views of a largely horizontal cave. For example, a lower level survey shouldn't influence the artwork associated with surveys located far above it. In practice we can ignore this issue for many caves. The inclusion of unrealistically weighted vectors will often have no noticeable effect on the adjustment of artwork; however, when the relative positions of upper and lower survey lines change significantly, some unwanted distortion can occur near crossover points. In that case it should be relatively easy for the Illustrator user to touch up those areas, thereby creating a new SVG source file that likely won't require the same repairs again. Another option, of course, is to work with different levels of the cave separately and combine them later when necessary. Finally, you may have vector lines (e.g., surface surveys) you want to include on the map but whose influence on surrounding map features you want to remove completely. You can do this by flagging a vector's representation while in Illustrator or by editing the SVG text. (For details, see the w2d Vectors layer description under SVG Layer Definitions.)
A longer-term goal is to support SVG roundtripping with drawing programs other than Adobe Illustrator. Perhaps because the format is necessarily complex, no other popular program seems to support it quite well enough for our purposes. That means it should at least be able to roundtrip its own SVG files and preserve the XML id's that label vectors. (Tee Using Other Drawing Programs.) The good news is that interest in SVG seems to be increasing steadily, especially in the open source community and among GIS users and developers.