Here are a few definitions pertaining to the geometry, or physical connectivity, of a survey network. Our usage of such terms as vector, loop system, traverse chain, etc., is not meant to suggest a terminology accepted by most cave surveyors, but is intended to help you understand the Geometry page of the Walls review dialog and its function as a data screening tool.
In discussing the geometry, we use the term vectors to denote the elemental components of a survey network, the observed displacements between pairs of named stations. Usually they are the shots (or legs) we record in our field books, each consisting of a set of actual measurements convertible to a three dimensional vector. They can also be the vectors connecting so-called control points (GPS fixes, locations scaled from maps, etc.) to an implied zero reference.
Cave surveys can contain vectors that are deficient in either of the horizontal and vertical dimensions. Radio locations and some GPS fixes have no observed vertical component, while vectors that serve only to constrain points to a known level (an underground lake, for instance) have no horizontal component. In fact, vectors restricted to one or two dimensions will arise routinely in the context of this program, where we will be throwing out, if only temporarily, the vertical and/or horizontal components of traverses.
Therefore, it's important that the geometric terms we will be using are separately applicable to each of the horizontal and vertical components of a survey network. Even with this qualification, some kinds of survey measurements don't neatly fit this simple vector model (e.g., turned angles, triangulations, incomplete shot data), but they are comparatively rare in cave surveying and shouldn't complicate this discussion of basic terminology.
Components and Loop Systems
Two vectors are connected if they share the same named station as an endpoint. A set of vectors is consistent if the connectivity indicated by their named endpoints is compatible with the values of their components. In other words, assuming their components are east-north-up displacements, consistent vectors can be plotted to show their connectivity with no distortion or "misclosures". Since only the simplest cave surveys are consistent in this strict sense, we will associate consistency with certain numbers, or statistics, that can be computed from the data. These numbers will help us assess the severity of misclosures.
A traverse is one vector or a sequence of vectors connected end-to-end. Here we are using the term to denote a geometric entity, not an activity carried out by a particular team of surveyors (or result of such). A loop is a closed nonintersecting traverse -- one in which the starting and finishing endpoints are the same and each intermediate endpoint is encountered only once. Traverses can also form traverse chains (described below) for which data screening statistics are computed in Walls.
A survey network is a collection of vectors consisting of one or more connected components, each being, as you might expect, a maximal subset of vectors having the property that between any chosen pair of stations there exists a traverse connecting them. (If the stations are fixed with respect to a common datum, we consider that a traverse in this geometric sense.) If there is only one traverse connecting them, then that traverse (and each vector therein) is termed a bridge. When a portion of your project's data is compiled by Walls, the separate pieces of the resulting network are listed under "Components" on the Geometry page. You can then choose which one of these you want to examine in detail.
A loop system is a maximal subset of vectors such that given any two vectors in the subset there exists at least one loop containing them both. All vectors are either bridges or parts of loop systems. It is the nature of some adjustment methods (e.g., least-squares), that one vector's measurement will contribute to the final estimates of all vectors in the loop system that contains it. Also, the effect on consistency of a bad measurement will not extend beyond the containing loop system. In Walls, loop systems are important since we will be picking them apart during the data screening process.
Traverse Chains
We can now describe the parts of a survey network that will be the main focus of our attention when searching for data errors. Two vectors in a loop system belong to the same traverse chain if every loop that contains one of them contains them both. Each loop system is uniquely decomposable into a set of traverse chains, not loops. These objects are of special interest to us since they are the smallest components of a survey network to which blunders can be localized due to bad loop closures. (Here we're assuming nothing about a vector's error probability.) In the past, cave software developers have used the term string to describe the traverses to and between "junction" stations and "dead-end" stations, but for our purposes traverse chain is a more useful concept. By definition, dead-end traverses, bridges between loop systems, and articulation points, are excluded from consideration. (Note: Traverse chains were called "links" in earlier versions of Walls.)
|
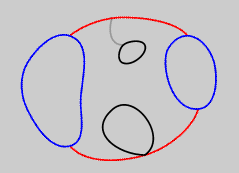
While most traverse chains are single traverses, it's not unusual for a loop system to have chains consisting of two or more non-contiguous traverses. In fact, when we say "traverse chain" instead of "traverse" we'll normally mean a multi-traverse chain. The diagram at left illustrates a connected component with three loop systems -- two 1-traverse systems (black) and one 6-traverse system (blue and red). The 6-traverse system has a traverse chain consisting of two traverses -- an upper traverse and a lower traverse (both red). |
If some vector's measurement were grossly in error, we might narrow its location to a traverse chain, but not to a specific member of the chain without making further assumptions about the error. The members of a multi-traverse chain, which we'll call chained traverses, all have the same F-ratio and the same best correction. On the Geometry page in Walls, a loop system's traverses are initially sorted by their decreasing F-ratios (horizontal and vertical combined). This usually allows us to recognize chained traverses by a grouping of two or more traverses with identical statistics. (The statistics are also displayed with a gray instead of white background.) Another way to detect these objects is by inspecting the Map page. When a chained traverse is selected, it's colored red on the preview map while the other members of the chain are colored light blue.
You'll discover that floating a chained traverse has the immediate effect of turning the other traverses in the chain into bridges. This means they are technically no longer loop components but instead are unadjusted connections between what are now separate loop systems. Unlike ordinary bridges, which are unfloatable, chained traverses that were made bridges by the floating of other chain members are themselves "floatable" in a sense. When you float multiple parts of a traverse chain via the Geometry page's Float button you are selectively distributing the best correction across the entire chain. For details, see Floating Traverse Chains.
Loop System Properties
An important property of a loop system and one that largely determines the effectiveness of statistics measuring consistency is the loop count, or the number of redundant traverses it contains. This can be calculated as the number of (unfloated) traverses minus the number of traverse junctions plus one. (A 1-traverse system is a special case and is regarded as having a loop count of one.) In the Geometry dialog both the horizontal and vertical loop counts are displayed for the selected system. You'll see that floating a traverse reduces the loop count by one.
Finally, some surveys contain numerous isolated loops, each being a 1-traverse loop system. The above diagram, for example, shows two isolated loops -- one attached to the larger system by a bridge and the other by an articulation point. In the Geometry dialog, Walls lumps these together as if they were a single loop system for display and analysis purposes.
For a discussion of how network geometry relates to data screening in Walls, see Data Screening Tutorial.