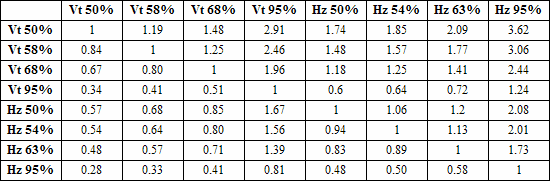
This table can be used to estimate one kind of position error statistic from another. To estimate a statistic on the top from a statistic on the left, multiply by the number in the cell where the corresponding column and row intersect. "Vt" in a label indicates that the statistic is the error of a single coordinate in length units, whether it be easting, northing, or elevation. "Hz" indicates that the statistic is the error in length units of a horizontal position. The percentages indicate the type of confidence region the length represents. These particular regions are often referred to as follows:
Vt 50% |
Median absolute error of a single coordinate. |
Vt 58% |
Mean absolute error of a single coordinate. |
Vt 68% |
Root-Mean-Squared (RMS) error of a single coordinate (standard deviation). |
Vt 95% |
95% bound on size of a single coordinate's error. |
Hz 50% |
Median horizontal position error, or Circular Error Probable (CEP). |
Hz 54% |
Mean horizontal position error. |
Hz 63% |
Horizontal Root-Mean-Squared (RMS) error. |
Hz 95% |
95% bound on length of horizontal error. |
Since the Walls data format allows point accuracies to be specified as RMS error (see Variance Assignments), you might want to use the table to convert a different kind of accuracy estimate to the equivalent RMS error.
For example, suppose you have a GPS location whose horizontal error is believed be less than 3 meters with 95% confidence. To convert this to an RMS error that can be used by Walls, you would multiply by 0.58, the number at the intersection of the "Hz 63%" column and "Hz 95%" row. The RMS error is therefore 0.58 x 3 = 1.74.
Another example: Suppose you have a location estimate where you believe the standard deviations of the two horizontal coordinate errors are each 10 feet. Since standard deviation of a single component corresponds to the "Vt 68%" row, we use that and the "Hz 63%" column to obtain RMS error = 1.41 x 10 = 14.1 feet.
The Hz values in the table are based on the Rayleigh distribution, a special case of the bivariate normal distribution where it's assumed that the two variables (coordinate errors in this case) are uncorrelated and have the same variance. These assumptions don't strictly hold, but they're commonly accepted in studies of GPS accuracy.
A detailed discussion of GPS receiver accuracy can be found at David L. Wilson's GPS Accuracy Web Page.